Ngapuhi Safety Snapshot

Northland, New Zealand

Police data to August 2026

Generates a printable report with charts & summary.

Is Ngapuhi safe? It has more recorded crime than most NZ suburbs. Ngapuhi has a safety score of 21/100, meaning less recorded crime harm per resident than about 21% of New Zealand suburbs, with 39.2 recorded crimes per 1,000 residents a year. It is the #74 safest of 97 ranked suburbs in Northland.

The annual total crime rate in Ngapuhi is 39.2 crimes per thousand residents, making it the #74 safest of 97 ranked suburbs in Northland Region. The overall crime trend in the area has decreased in recent months with criminal activity peaking in February 2026, March 2026, August 2026.

How the safety score works

Safety Score (NZCHI-adjusted)

iHow it works
21 / 100
Crimes per 1,000 residents
i
39.2
Regional rank #74 / 97 (Bottom 25%)
3-Month Trend
i
▼28.6%(improving)

Offence breakdown · past 12 months

Based on total incidents. Police data to August 2026
  • Assault 30.0%
    Assault accounts for 30.0 percent of incidents.
  • Burglary 27.0%
    Burglary accounts for 27.0 percent of incidents.
  • Theft 12.0%
    Theft accounts for 12.0 percent of incidents.
  • Sexual Offences 3.0%
    Sexual Offences accounts for 3.0 percent of incidents.
  • Harm Or Endanger Persons 1.0%
    Harm Or Endanger Persons accounts for 1.0 percent of incidents.
  • Robbery, Blackmail, And Extortion 1.0%
    Robbery, Blackmail, And Extortion accounts for 1.0 percent of incidents.

View full safety overview for Ngapuhi ›

Ngapuhi Demographics

2023 Census data

Loaded live from the API for this suburb.

Population

1,920

Households

489

Median income

$66,929

Median rent

$297

Age distribution

Share of total population.

Age 0-14
357 (18.6%)
Age 15-64
1,317 (68.6%)
Age 65+
255 (13.3%)

Birthplace

Share of stated birthplace records.

Born in NZ
1,767 (93.6%)
Born overseas
120 (6.4%)

Ethnicity

Normalised to ethnicity responses (can exceed population).

European
792 · 32%
Māori
1,467 · 59.3%
Pacific
153 · 6.2%
Asian
39 · 1.6%
MELAA
6 · 0.2%
Other
18 · 0.7%

Home tenure (as stored)

Normalised to stated total when present.

Owned
1,008 · 100%
Not owned
570 · 56.5%
Other
549 · 54.5%

Household composition

Normalised to household composition total.

One family
258 (18.7%)
Two families
21 (1.5%)
Three+ families
0 (0%)
Other composition
1,104 (79.8%)

Demographic data sourced from Stats NZ , licensed under CC BY 4.0

FAQ

  • Is Ngapuhi a safe suburb to live in?

    Ngapuhi has a safety score of 21/100, making it the #74 safest of 97 ranked suburbs in Northland Region. 53% of recorded crime is property crime (theft, burglary, fraud or damage).

  • What is the crime rate in Ngapuhi?

    The annual crime rate in Ngapuhi is 39.2 recorded crimes per 1,000 residents.

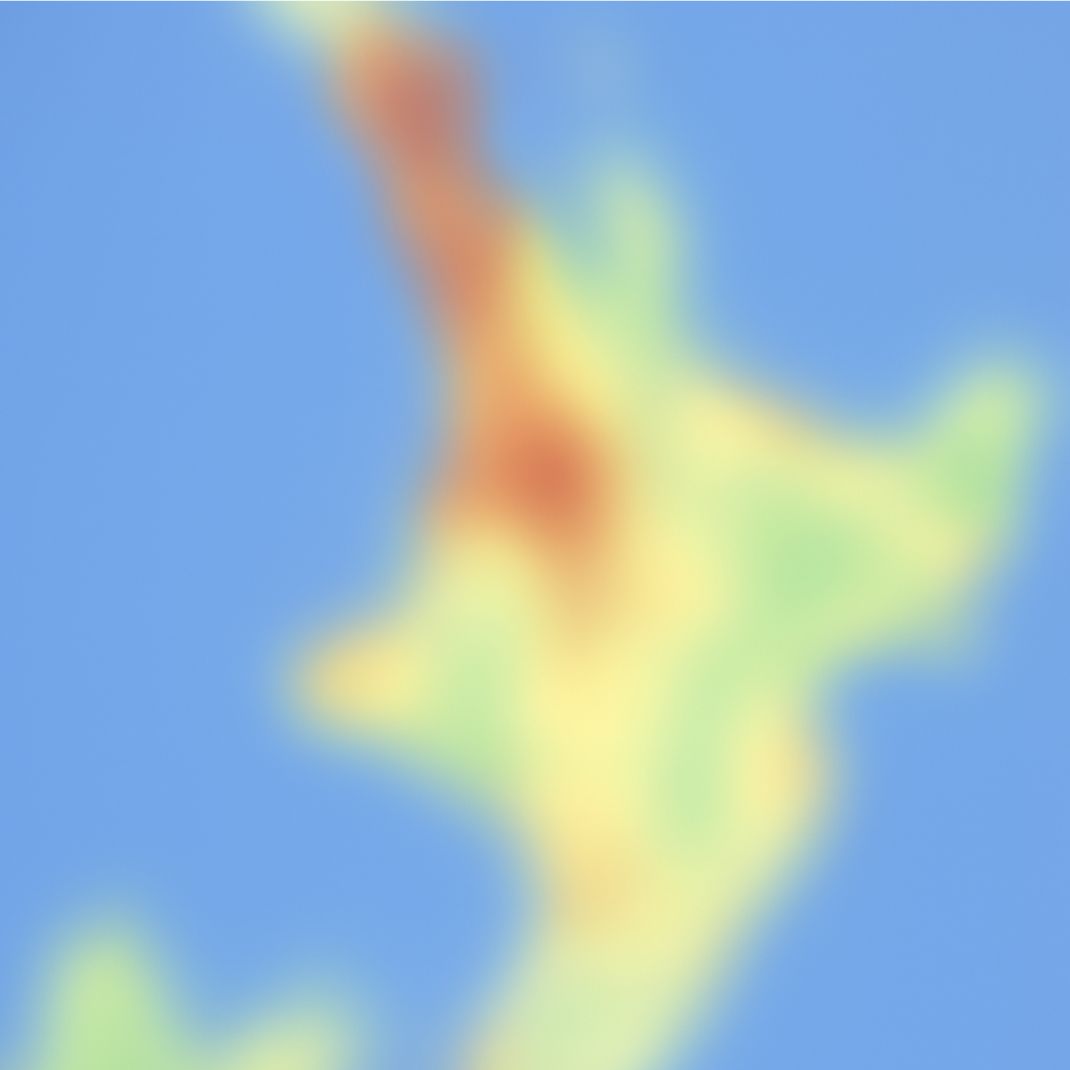
Crime heatmap for Ngapuhi

For deeper suburb insights visit CrimeStats.co.nz

Nearby Suburbs