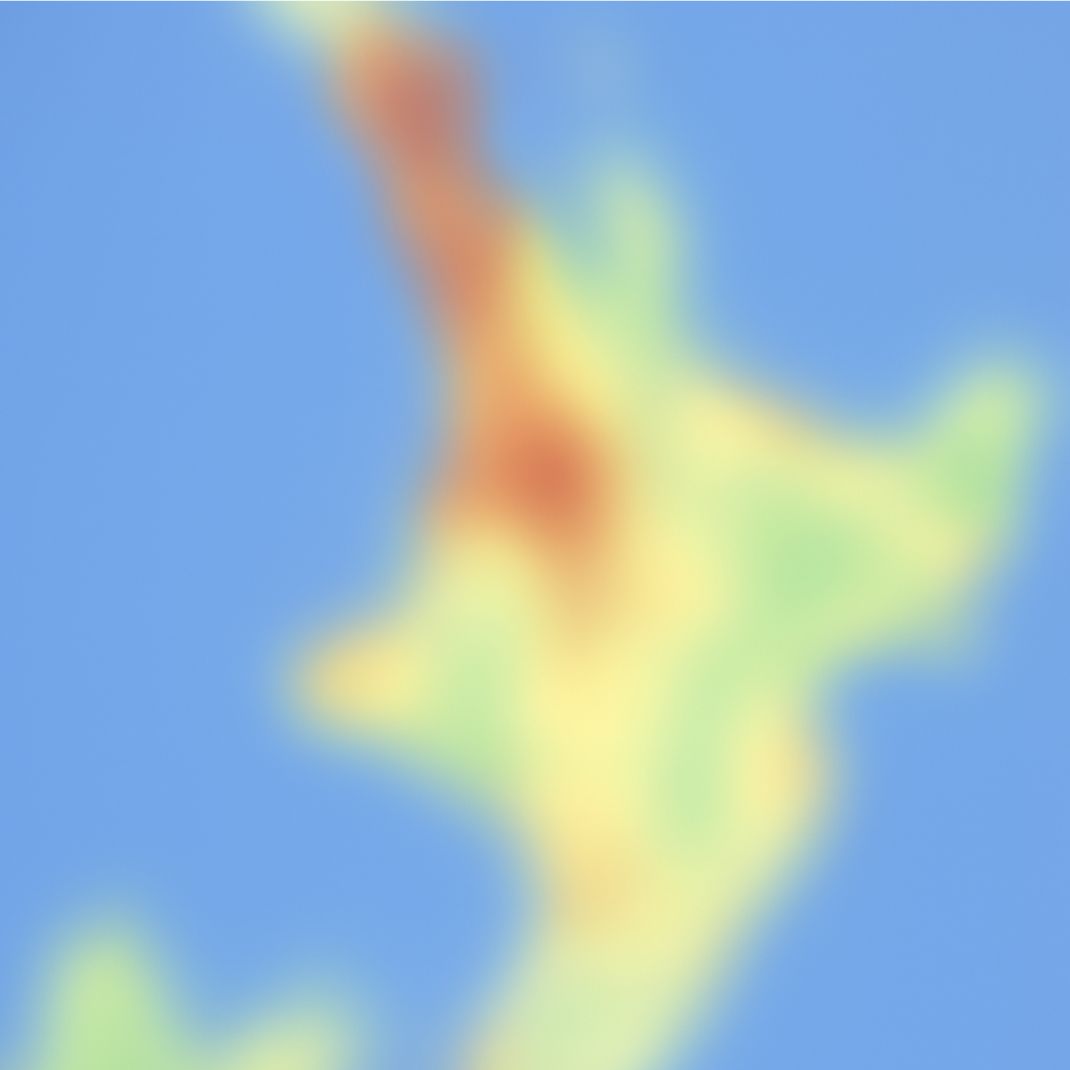
Northland, New Zealand
Police data to August 2026
Generates a printable report with charts & summary.
Is Kamo East safe? About average. Kamo East has a safety score of 42/100, meaning less recorded crime harm per resident than about 42% of New Zealand suburbs, with 27.8 recorded crimes per 1,000 residents a year. It is the #43 safest of 97 ranked suburbs in Northland.
The annual total crime rate in Kamo East is 27.8 crimes per thousand residents, making it the #43 safest of 97 ranked suburbs in Northland Region. The overall crime trend in the area has decreased in recent months with criminal activity peaking in December 2025, February 2026, March 2026.
Loaded live from the API for this suburb.
Population
3,267
Households
1,041
Median income
$90,184
Median rent
$509
Age distribution
Share of total population.
Birthplace
Share of stated birthplace records.
Ethnicity
Normalised to ethnicity responses (can exceed population).
Home tenure (as stored)
Normalised to stated total when present.
Household composition
Normalised to household composition total.
Is Kamo East a safe suburb to live in?
Kamo East has a safety score of 42/100, making it the #43 safest of 97 ranked suburbs in Northland Region. 88% of recorded crime is property crime (theft, burglary, fraud or damage).
What is the crime rate in Kamo East?
The annual crime rate in Kamo East is 27.8 recorded crimes per 1,000 residents.