Queens Square Safety Snapshot

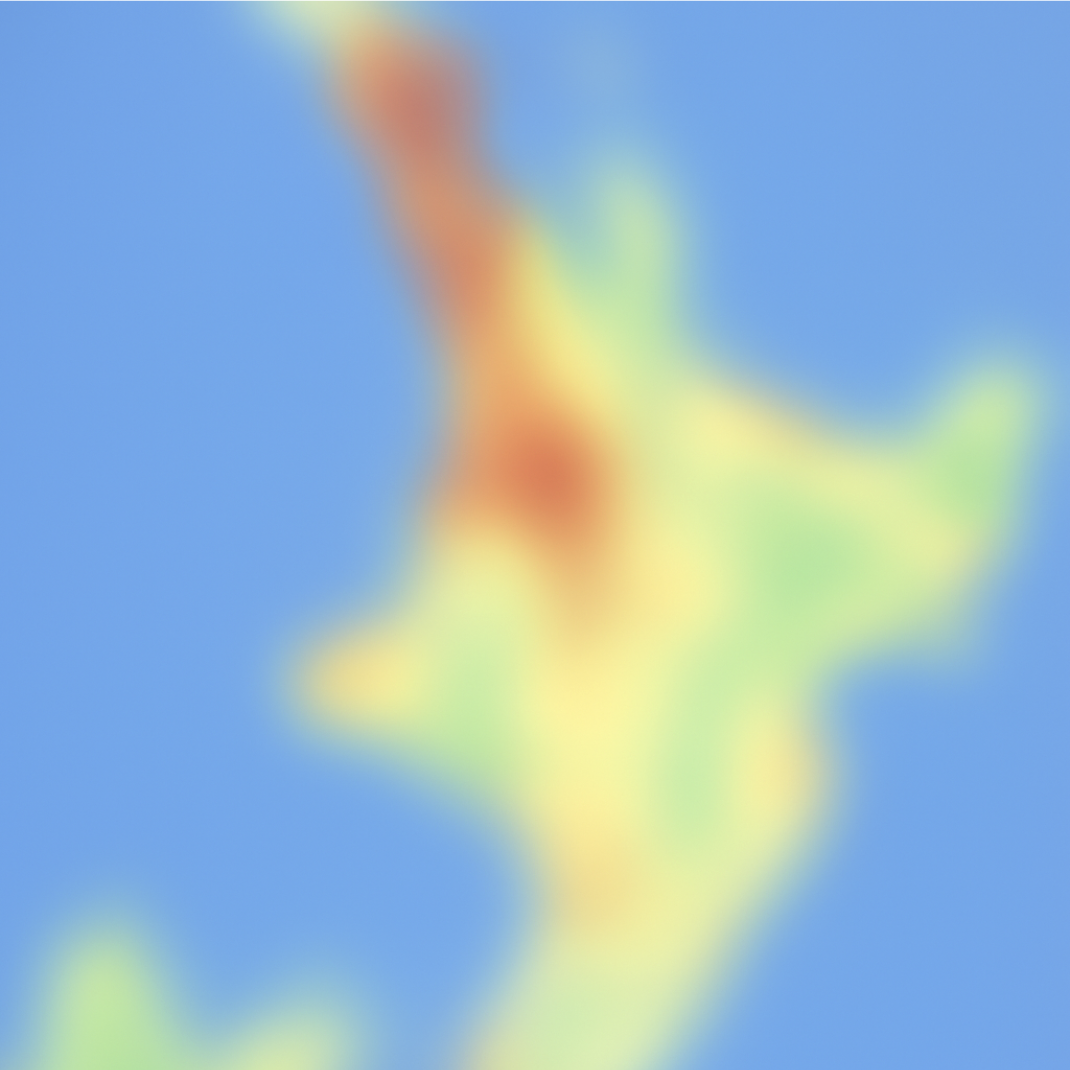
Hawke's Bay, New Zealand

Last updated:

Generates a printable report with charts & summary.

The annual total crime rate in Queens Square is 29.9278 crimes per thousand residents, placing it at rank 48 within Hawke's Bay Region. The overall crime trend in the area has decreased in recent months with criminal activity peaking in February 2023, July 2023, May 2024.

Safety Score (NZCHI-adjusted)

i
72 / 100
Crime harm per 1,000 residents
i
29.9
Regional rank #48 / 58 (Bottom 25%)
3-Month Trend
i
42.1%(improving)

Offence breakdown · past 12 months

Based on total incidents. Updated October 2025.
  • Theft 57.1%
    Theft accounts for 57.1 percent of incidents.
  • Burglary 32.6%
    Burglary accounts for 32.6 percent of incidents.
  • Assault 8.8%
    Assault accounts for 8.8 percent of incidents.
  • Robbery, Blackmail, And Extortion 1.1%
    Robbery, Blackmail, And Extortion accounts for 1.1 percent of incidents.
  • Sexual Offences 0.4%
    Sexual Offences accounts for 0.4 percent of incidents.

View full safety overview for Queens Square ›

Queens Square Demographics

2023 Census data

Loaded live from the API for this suburb.

Demographic data sourced from Stats NZ , licensed under CC BY 4.0

FAQ

  • Is Queens Square a safe suburb to live in?

    Queens Square ranks in the top 51 of suburbs in Hawke's Bay Region for safety, with most crime being non-violent property offences.

  • What is the crime rate in Queens Square?

    The annual crime rate in Queens Square is 29.9278 per 1,000 residents.

Crime heatmap for Queens Square

For deeper suburb insights visit CrimeStats.co.nz